Usage Analytics
Auditing costs, analyzing trends, and tracking consumption across workspaces.
While the Billing tab handles the money coming in, the Usage Tab tracks where the resources are going out.
This dashboard is your "Receipt." It provides granular transparency into every second of audio processed and every token generated.
Usage Overview
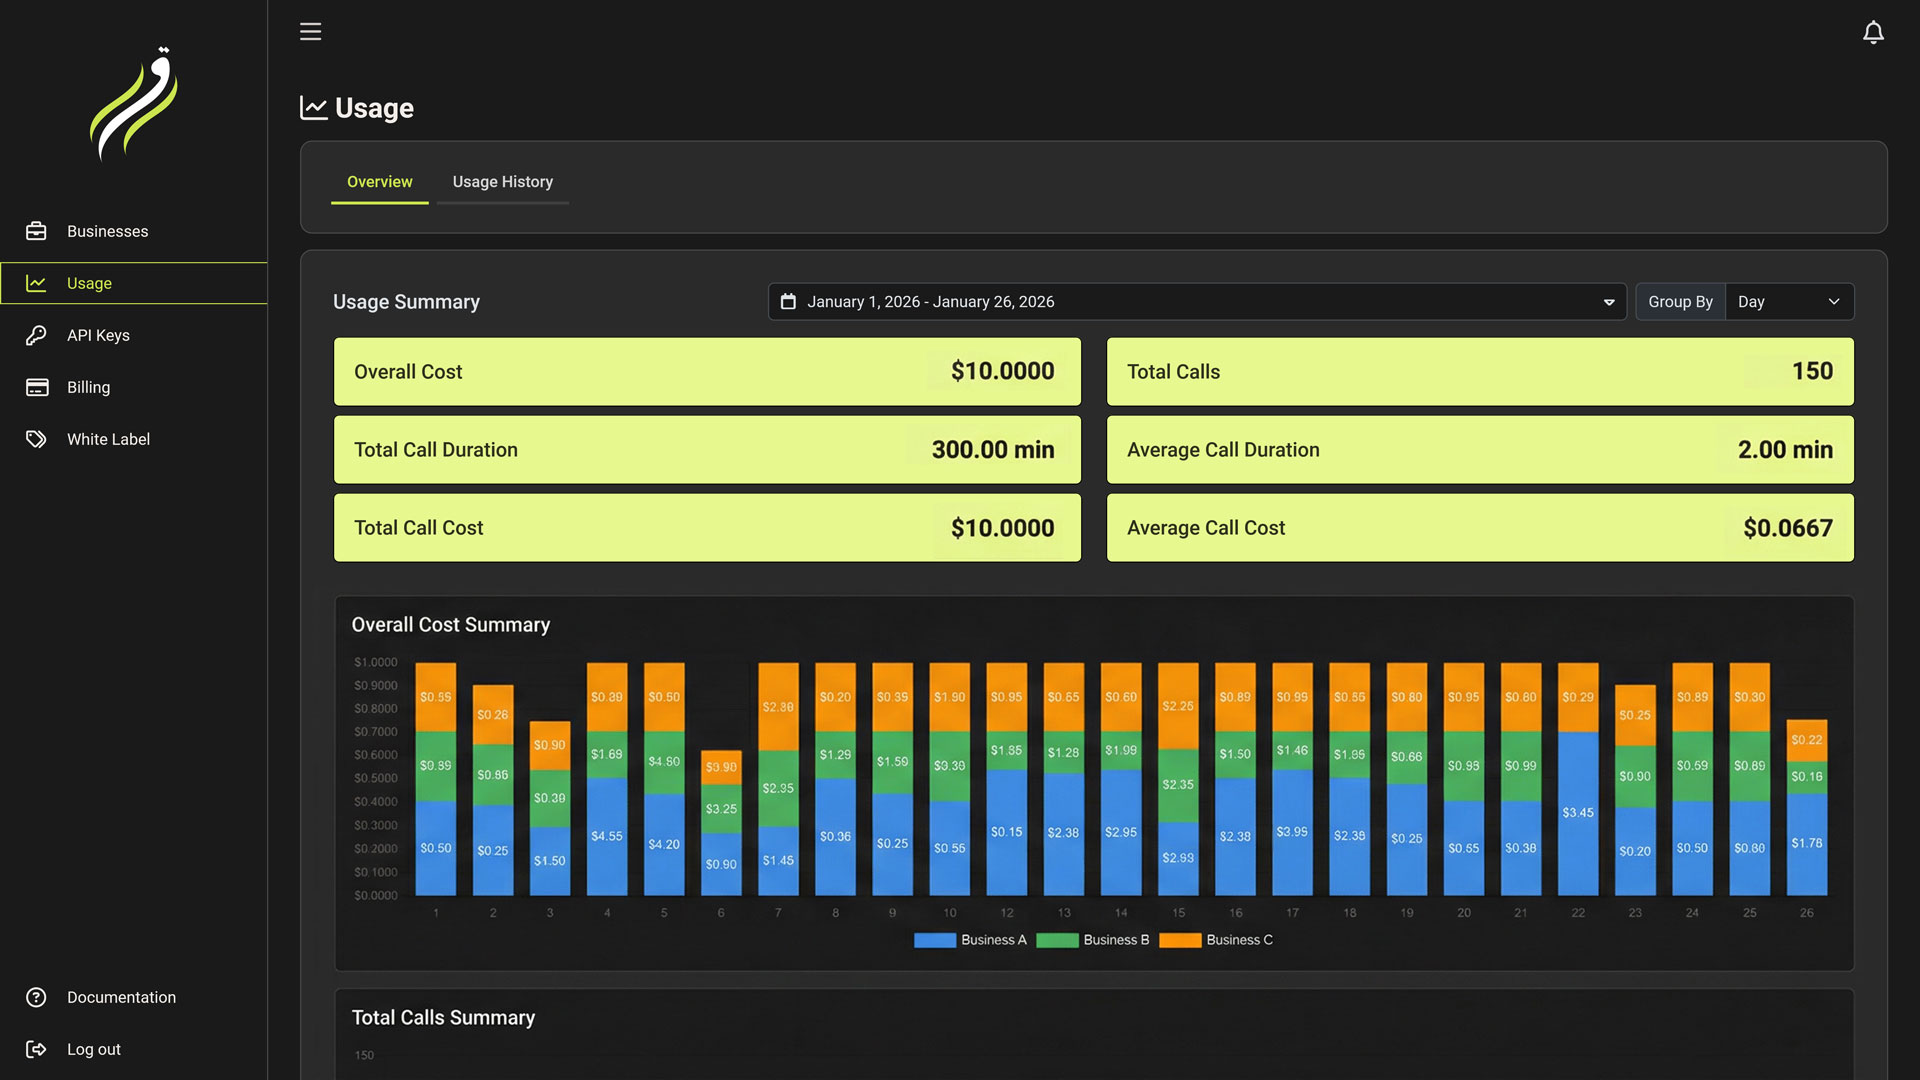
The Overview Tab provides high-level metrics for business owners.
- Cost Analysis: View your total spend over time (Daily/Monthly).
- Volume Metrics: Track total Calls, Minutes, and Request counts.
- Grouping: Break down costs by:
- Day/Month: Spot usage spikes.
- Business: Identify which Workspace/Client is consuming the most resources.
Cost Control
Use the Group by Business feature to determine the profitability of your agency clients. If "Client A" is costing $500 but paying you $300, you need to adjust their plan.
Usage History
The History Tab is the detailed ledger. It records every single billable event in the system.
Understanding Line Items
Each row represents a specific consumption event.
| Column | Description |
|---|---|
| Date | Timestamp of the event. |
| Business | Which workspace generated this cost. |
| Feature | The resource used (e.g., Conversation Minutes, Voicemail Detection, TTS Cache Queries). |
| Quantity | The amount consumed (e.g., 5.2 Minutes, 1 Detection, 5 Cache Queries). |
| Cost | The final amount deducted from your balance (or quota). |
Filtering
You can drill down into specific data points using the filter bar:
- Date Range: "Last 7 Days", "This Month", or Custom Range.
- Business: Isolate logs for a specific client workspace.